In this first section we are going to take a long look at a hundred years in which the city of Bilbao underwent enormous changes and transformations. When the 19th century began, the city was a small but prosperous commercial town. Historians tend to define its activity and development with great accuracy as a product of the activities of its port and its loading and unloading docks, which at that time were located in the vicinity of the church of San Antón and in the space now occupied by the Ribera market.
During the 19th century, the town, in line with the rest of Spanish and European society, will gradually dilute the socio-economic structure of the Ancien Régime towards an urban-industrial one that will produce an unprecedented growth and development. But let us not get ahead of ourselves. This so-called transition will not happen overnight and will require a century of small achievements and difficulties, sometimes bloody, such as the two Carlist wars, to achieve the installation of this new modern society.
It should be stressed that the case of the town of Bilbao is a different model, both economically and socially, from the urban world of the Ancien Régime. It should be borne in mind that the pre-industrial society was strictly rural, its economy was fundamentally rural, as opposed to a very relative urban demographic and socio-economic weight. Within this framework, Bilbao was a city that had no ‘countryside’ and therefore no farmers. Its wealth and prosperity, consolidated in the 18th century, came from its port, from trade based on products such as Castilian wool, cod and iron produced in the interior of the province of Biscay (Gutiérrez: 1994). These briefly enunciated features of its activity help us to get an idea of the specificity of Bilbao within the state framework of production and economy, where the cities were not many either in number or in total urban population and where their main activity, despite being cities, continued to be basically and principally agriculture.
If we begin this demographic section with the statement that Bilbao was a small city both in terms of its small size and its number of inhabitants, it may seem rather surprising. However, it is a true statement if we compare Bilbao with other cities in the peninsular framework where cities such as Seville were inhabited by about one hundred thousand inhabitants, i.e. ten times more than Bilbao at the same time (Reher: 1994).
In table 1 we can clearly observe the evolution that Bilbao underwent throughout this century, starting the century with only eleven thousand inhabitants and finally multiplying its total population by eight. This is where we can once again point out the enormous singularity of Bilbao within the national framework, since it can be affirmed that no other Spanish city was able to develop such enormous and rapid growth in the 19th century, a clear sign of the capacity it had to liquidate the Ancien Régime and give way to a different industrial society based on the iron and steel industry (Nadal: 1986).
Table 1: Total population, growth and its components. Bilbao, 1800-1900
| Fuentes: Censos de Población: Instituto Nacional de Estadística | ||||
| Registro parroquial: Archivo Histórico Eclesiástico de Vizcaya | ||||
| Registro Civil: Archivo del Registro Civil de Bilbao | ||||
| Total Población | Crec. Real (r) | Crec. Natural | Saldo migratorio | |
|---|---|---|---|---|
| 1800-1860 | 11.407 | |||
| 1870 | 17.923 | 0,76 | 4.408 | 2.108 |
| 1860-1870 | 19.417 | 0,8 | 2.411 | 917 |
| 1890 | 55.632 | 5,4 | 4.342 | 31.873 |
| 1870-1890 | 4,12 | 5.849 | 21.825 | |
If we look at the figures in Table 1, we can see that during the first seventy years of the 19th century, both the number of inhabitants and the rate of growth were very slow. In fact, the growth value ‘r’ gives a value of less than one per cent per year, a value which was the general trend throughout the whole of the Ancien Régime and which means that a population needs more than fifty years to double its number of inhabitants. It must be said, however, that the first half of the 19th century was very difficult due to two episodes of war which did not exactly help normal economic development. We are referring to the War of Independence (1808-1812) and the first Carlist War (1833-1841), both of which were very severe in the Basque Country.
All in all, once this war was over, we can say that the economic-productive that had brought Bilbao great prosperity had been definitively liquidated. The whole commercial of exchange northern Europe, the centre of Castile and the American colonies, whose epicentre was in Bilbao, entered into a crisis of no return. During the inter-war period and clearly after the Second Carlist War (1871-77), a new future began to be forged in which the city was involved (González Portilla, dir: 1995: 84-91).
Table 2, which s the activity of the inhabitants of Bilbao by sector of activity, s that during the pre-industrial period, the population was basically dedicated to the tertiary sector. In contrast, at the end of the century it was the industrial sector that occupied the majority of the town's inhabitants.
| Fuente: Padrones de habitantes: Archivo Municipal de Bilbao | ||
| 1825 | 1900 | |
|---|---|---|
| Primario | 5,6 | 4,7 |
| Secundario | 34,1 | 58 |
| Terciario | 60,3 | 37,4 |
The effects of a new economy based on iron mining, its export to England and the installation of the first blast furnaces in Barakaldo and Sestao, gave rise to a new, widened and modern city which became a financial capital and the driving force behind a new development (González Portilla, dir., 1995: 95-114). The large supply of jobs led to a large influx of immigrants to the entire metropolitan area, which explains the disproportionate growth figures n in table 1 in the last decade of the 19th century. This change of sign in the city can be seen precisely in the comparative figures natural growth (the balance births and deaths) and the migratory balance (the difference emigrants and immigrants). If during the first half of the century the city grew at a moderate rate but basically sustained by the greater number of births over deaths, in the last decades we cannot but notice that this growth was sustained by eight times the number of immigrants than the city's own natural demographic dynamics had been producing.
At this point it would be interesting to make an aside on an issue that greatly marked the history of the town and its demography in particular. I would like to refer to the territorial annexations that took place in the municipality throughout its history. This question is of particular importance since it is common that when we handle data on the town of Bilbao over many years we forget that its territorial space increased over time and therefore its figures do not always refer to the same territorial space (González Portilla, dir., 1995: 321-402).
Historians of the modern history of Bilbao know well that a constant obsession on the part of the municipal authorities was precisely the enormous restriction on granting the status of neighbour to new inhabitants, which gave the right to exercise full rights and duties within its space. This condition was enormously restrictive, and responded precisely to a constant problem of space within its jurisdictional limits, which had not been possible to increase since the 17th century due to the immediate vicinity of the parishes of Abando, Begoña and Deusto. In other words, Bilbao was reduced to what we know today as the Old Quarter as far as the City Hall and along the banks of the estuary as far as the San Antón bridge.
| Fuente: Reseña estadística de la provincia de Vizcaya: Instituto Nacional de Estadística | |
| Densidad de población | |
|---|---|
| 1857 | 301,1 |
| 1860 | 302,2 |
| 1877 | 550 |
| 1887 | 850,3 |
| 1897 | 1.245,50 |
| 1900 | 1.400,80 |
In the mid-19th century, as can be seen in Table 3, the population density of the town was one of the highest in Spain. Taking into account the enormous increase in population from the last third of the century onwards, it is clear that it was necessary to extend the municipal jurisdiction. The first enlargement was carried out in 1870 when the first part of Abando was incorporated into the town, the part corresponding to the bank opposite the Old Quarter. As the city continued to grow at a very fast pace, these enlargements soon proved to be insufficient, and the definitive annexation of Abando was completed in 1890 (González Portilla, dir., 1995: 357-370). However, as can be seen in Table 3, the enormous congestion experienced by the town in the last quarter of the century was particularly acute, since from 1877 to 1900 the density of inhabitants per square kilometre had multiplied threefold despite the increase in space, causing a worsening of the quality of urban life.
With regard to the previous point, it should be pointed out that a large part of the increase in population and especially of the immigrants who arrived en masse after the second Carlist war, faced with the impossibility of settling in Bilbao, did so above all in the surrounding parishes which, as we know today, are close enough to commute to work from their place of residence. This is why the official population figures for Bilbao and the growth rates during the 19th century often do not fully reflect the reality of the town if this particular circumstance is not taken into account.
To demonstrate what we have been saying, a picture is worth more than many words and we can see in graph 1 the evolution of the growth of the town of Bilbao from 1800 to 1870. That is, before the first annexations took place. In this case, we have taken the number of annual births, on the one hand, of the four parishes of Bilbao (San Antón, Santiago, Santos Juanes and San Nicolás) and, on the other, the sum of the three parishes before them, in order to plot them over time. It should be pointed out that in pre-industrial times, when the growth of a population is basically measured by vegetative growth, the evolution of the number of births is equivalent to any other measure of demographic growth.
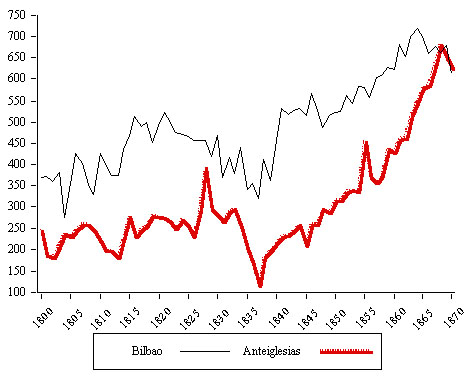
Gráfico 1: Evolución del número de nacimientos en Bilbao y las anteiglesias de Abando, Begoña y Deusto, 1800-1870. Fuente: Registro parroquial: AHEV
Two interesting conclusions can be drawn from graph 1. Firstly, if we observe the two curves during the whole period, we can see how the curve of the anteiglesias only juxtaposes with that of its neighbour Bilbao in an almost exact manner from the 1930s onwards. This is explained by the fact that despite the complementarity of their economies, in reality they will not be the same economy until the transition towards the industrial production in which the whole urban space will be immersed. And secondly, it was only after the end of the first Carlist period that the evolution of births in the parishes began to keep pace with those in Bilbao and to increase more exuberantly than in the town. We can express this in numbers. In the 1940s, the number of births in the three parishes accounted for around fifty percent of those in Bilbao. However, in the end, the number of people born in the parishes was as much as the number born in the town as a whole. This s that the settlement of immigrants, young people of working age, of marriageable age and therefore of childbearing age, was taking place mainly outside the jurisdictional limits of Bilbao. It was clear that the city had long since exceeded its capacity to take in new residents and that only with the first annexations was it able to absorb the new immigrants that the city was attracting.
--
Translated with DeepL.com (free version)
Before beginning with the interpretation of the pre-industrial demographic model of Bilbao, it is worth making a digression that refers to the problems of demographic sources that for one reason or another we have to regret in Bilbao. It is known that the 19th century saw the birth of the statistical era and, therefore, at state and local level great efforts were made to collect all possible information about its inhabitants. However, the fateful floods of 1983 caused us to lose a large part of the documentation corresponding to the 19th century that was stored in the basements of the Municipal Archive in Bidebarrieta. The water and mud took away forever the original family sheets from the censuses of 1857, 1860, 1877 and 1887. Precisely in the crucial years of change and growth in Bilbao and that would have been so interesting to analyze from the socio-demographic point of view. Thus, we can define the 19th century in Bilbao today as a "documentary desert" of which we only preserve a starting point and an end. We are referring to the Police Census of 1825 deposited in the Archive of the Casa de Juntas of Guernica, after which we must jump to the Municipal Register of 1900, which is the oldest available today. these dates we only have loose data, secondary sources, often the result of the work of statisticians who published summary data.
Among the few "still photos" or population pyramids available for the 19th century, the one from 1869, n in Figure 1, is particularly interesting. This date is very significant as it reflects within itself the entire experience of the transition experienced by this city at a time when it was no longer a pre-industrial society but was not yet fully an industrial and urban society in the proper sense. In other words, it is the reflection and synthesis of the instability and change in which the people of Bilbao were immersed at that time.
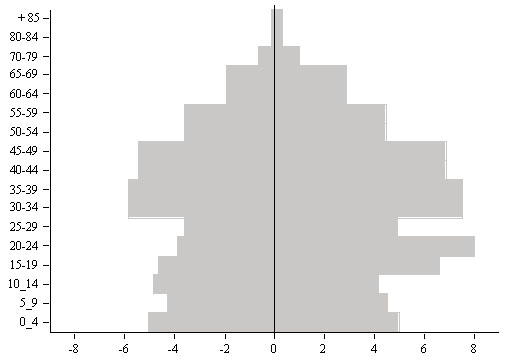
Figure 1: Population pyramid of Bilbao in 1869. Source: Population Census: INE
When analysing a population pyramid, its shape is usually described: a wide and not very high base corresponds to traditional societies; a narrow and rising base corresponds to more contemporary societies. In this case, in the Bilbao pyramid of 1869 we can see a moderately wide base that corresponds to the recently born generation. This situation is typical of the beginning of moderation in fertility and marriage, to which the young generations of the intermediate age groups contribute. In these age groups (20-30) we can also observe the effect of immigration, normally made up of single and young people. In the case of Bilbao we can observe the effect of the presence of maids 15 and 24 years of age, who later disappeared, and who formed an important group from the nearby countryside working for the emerging and wealthy bourgeoisie. Finally, at the top, the effects of the prevailing mortality regime are noticeable, which did not allow too many people to live too long.
As a complement to this pyramid of 1869, we can see in Table 4 a route throughout the entire 19th century in terms of the population structure, that is, what the summary of the pyramids would have been like over time.
Table 4: Structure of the population by age in Bilbao (%)
| 1825 | 1857 | 1877 | 1887 | |
|---|---|---|---|---|
| 0-14 | 33,28 | 31,81 | 28,66 | 29,56 |
| 15-64 | 63,04 | 79,40 | 65,46 | 64,43 |
| >65 | 3,63 | 4,80 | 5,88 | 6,01 |
Source: Population censuses: National Institute of Statistics.
Here we can see more clearly what we are pointing out when we define 19th century society as a transitional society. In 1825, still fully in a pre-industrial society, there were a large number of young people and barely 3% of older people. Over time, if we can detect any trend, it is that, from 1825 until the beginning of industrialisation, the younger generations gradually decreased and the population over 65 years of age doubled.
The demographic of Antiguo Régimen is based on where it is called a of "high pressure", it is decided, presidido by high rates of birth and mortality. This has a small margin for the increase in population and is combined with a late, moderately intense marriage, which is also a moderately successful marriage. If this is the cause of reduced migration movements, we have found the explanation of reduced population growth or indeed in the balance of pre-industrial societies.
We have decided, without embargo, that this demographic has been well studied and designed in all Western European populations, adapted much better to rural areas that were majority in this era. This is embedded in an economic based on the production of the tier in which it is not possible to multiply or contain more population if there is no increase in production (Flinn: 1989).
Recent investigations have demonstrated that the Antiguo Régimen's demographic is significantly different in urban areas. For this reason, we can qualify this process as “demographic urbanization”. You can define this as having a higher demographic pressure in the field. Un historiador englés ha llegado a calificar a la ciudades como de auténticas devoradoras de hombres (Wrigley y Schofield: 1981). The economy of the cities will be more precarious and subject to the vaivenes of the economy that in the rural world with the problem of not being able to return to the huerta to be able to come when traveling on vacation. For this reason, the marriage was very restrictive and took longer than that in the camp, because their births were not long in number. Hay to hold on to the fact that we were situated at a time when the marriage institution and the natural fertility marked the number of births. If you decide, it will not be socially acceptable for your husbands to be married. Because of the age of mortality, it was more intense than ever in the field. The conditions of health and hygiene and the high concentration of population that make cities stay safe are propitious for the spread of epidemics and all types of confinement. As a result of the balance, a city may have a natural negative increase as a result of a greater mortality than its birth. At the same time, the cities alone presented a moderate increase in population, only compensated and logged thanks to the continued influx of immigrants from the cercano camp (Pareja: 1997).
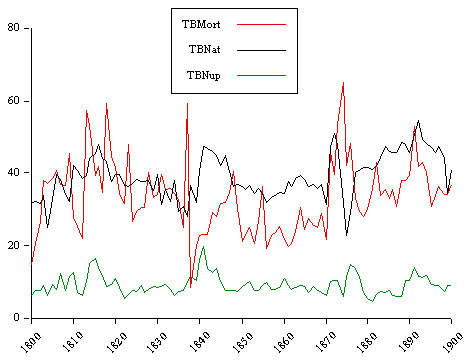
Graphic 2: Evolución de las tasas vitales de Natalidad, Mortalidad y Nupcialidad en Bilbao, 1800-1900. Source: Parish Registry: AHEV; Civil Registry: ARCB
This urban demographic that is described is very well reflected both in graphic 2 and in table 5, so it is very precise in the first part of the siglo. Sin embargo, we characterize the siglo XIX as a company in transition and this way we can distinguish very clearly different periods. For a long time, the interwar period during which there was a relative economic prosperity saw a considerable decline in mortality as the population increased. For another reason, in the last tercio of the siglo, the industrialization that is there is in its comienzos. This produces an influx of inmigrant workers, especially settled in the areas of San Francisco and Achuri, which causes a problem of livelihood and deterioration of the urban environment that the city cannot remedy in a short time. As a result, there is a considerable increase in the birth rate due to the greater presence of the young population and, on the contrary, a dramatic increase in mortality as a consequence of the deterioration of the population and the life conditions of the population. We conclude, at the sight of the data, that the beginnings of industrialization were dramatic in Bilbao as in the rest of Europe and Spain, and that the price of progress translates into death, even though it is the first of the economic changes (Pareja: 1997).
| Fuente: Registro parroquial: AHEV; Registro civil: ARCB | |||
| TB Natalidad | TB Mortalidad | TB Nupcialidad | |
|---|---|---|---|
| 1800-1810 | 34,03 | 33,15 | 9,06 |
| 1810-1820 | 42,12 | 40,7 | 11,21 |
| 1820-1830 | 37,87 | 34,67 | 8,08 |
| 1830-1840 | 34,12 | 34,51 | 9,54 |
| 1840-1850 | 42,14 | 28,85 | 11,47 |
| 1850-1860 | 34,77 | 24,19 | 8,96 |
| 1860-1870 | 36,59 | 24,61 | 8,4 |
| 1870-1880 | 38,77 | 39,83 | 9,88 |
| 1880-1890 | 45,08 | 35,75 | 7,14 |
| 1890-1900 | 46,28 | 38,54 | 10,24 |
If we apply the ideas of Maltusian type, a pre-industrial company only can control its growth or its death through marriage, there is only mortality that does not recognize medicos sufficient to actuate, and sobre los births, in the presence of methods of control of reproduction, poco se You can do it when your marriage is celebrated. For this reason, in the demographic of Antiguo Régimen it is considered that the variable of marriage, over all women, is the most important to follow your study.
In table 6 we present a series of indicators of marriage and fecundidad de Bilbao a lo largo del siglo XIX. The women of 1825 were married to a young woman late (28 years old) and with a very young marriage intensity in all generations (already of 42 years old). This combination cannot be used if it has some of the most modern characteristics. Hay that you should keep in mind that in these times, you have to go to the house so much for men as for women, you need a long time of dowry and preparation, that access to the land or you can't wait for an artisanal office that requires you to hope for many years until the gremios of the City gives its approval for the installation of a new taller craft that will allow a family to manage (Arbaiza: 1996).
Desde mediados del siglo journal. At the expense of low wages, this change permits a lot of employment without tier and without office, accessing the algo of dinero, both for men and for women that the permits are allowed to be employed more early than in previous times. This change is reflected perfectly in tabla 6 in the values that refer to the years 1887 and 1900. Indeed, women are as media one of our three years before that in the pre-industrial era and it was with greater intensity, causing an increase in fertility in this final fechas of the centuria.
| Fuente: Censo de Policía de 1825: Archivo de La Casa de Juntas de Gernika; Censos de Población: INE | ||||||
| The indicators of this table respond to the following calculations: Edad Media al Matrimonio: The values of 1825 respond to the SMAM (Standard Mean Age at Marriage) indicator, which calculated an approximate media based on census data which is not available from the matrimonial registers. In change, the values of 1887 and 1900 proceed from the Bilbain Civil Registry. The Celibato Definitivo is the calculation of the percentage of the number of couples/as sober the total of women/men in the group of edad of 45-49 years. The marriage rate is the proportion of married women to the total number of married women (%). The Matrimonial Fertility Index is the number of births of these years married women in fertile years (15-49). | ||||||
| 1825 | 1887 | 1900 | ||||
|---|---|---|---|---|---|---|
| Varones | Mujeres | Varones | Mujeres | Varones | Mujeres | |
| Edad Media al matrimonio | 25,22 | 28,2 | 27,13 | 24,79 | 27,25 | 25,17 |
| Celibato definitivo | 16,66 | 10,14 | 10 | 13,5 | 8,9 | 14,1 |
| Tasa de Nupcialidad | 42,09 | 44 | 47,54 | |||
| Tasa de Fecundidad matrimonial | 252,89 | 271 | 243,16 | |||
However, at this point it is worth making a couple of clarifications regarding the marriage and fertility at the end of the century. Firstly, the economic change meant the arrival of many immigrants from outside the Basque Country, attracted by the enormous supply of work. Contrary to what is usually thought, many immigrants arrived in the city with their families already formed, that is, married and with small children, or with fertility patterns typical of their rural places of origin, that is, higher, which they continued to maintain once they arrived here. This would also explain the extraordinarily high fertility rates that we find in the city, but in general, also in the entire recently industrialized area on the left bank of the Nervión (González Portilla, ed.: 2001).
| Fuente: Censo de Policía de 1825: Archivo de La Casa de Juntas de Gernika; Padrón de Habitantes: Archivo Municipal de Bilbao. | ||||||
| 1820 | 1900 | |||||
|---|---|---|---|---|---|---|
| Bilbao | 36,44 | 36,05 | ||||
| Resto C.A.Vasca | 58,2 | 30,07 | ||||
| Andalucía | 0,1 | 0,88 | ||||
| Aragón | 0,1 | 2,25 | ||||
| Asturias | 0,07 | 0,93 | ||||
| Baleares | --- | 0,08 | ||||
| Cantabria | 0,28 | 3,07 | ||||
| Castilla-León | 2 | 13,23 | ||||
| Castilla-Mancha | 0,03 | 0,65 | ||||
| Cataluña | 0,1 | 0,52 | ||||
| Com. Valenciana | 0,03 | 0,32 | ||||
| Extremadura | 0,07 | 0,08 | ||||
| Galicia | 0,35 | 1,64 | ||||
| Madrid | 0,14 | 2,07 | ||||
| Murcia | --- | 0,2 | ||||
| Navarra | 0,28 | 2,84 | ||||
| La Rioja | 0,38 | 3,74 | ||||
| Extranjero | 1,42 | 1,37 | ||||
Table 7 s this great change brought about by the shift to industrial society from the point of view of the social composition by origin of the population of Bilbao. In general, it can be noted that people from all parts of Spain have always lived in Bilbao. This is quite logical given the commercial and open character of Bilbao as well as its importance as the capital within the North of Spain. Even so, it can be seen that the majority of the population that lived in Bilbao during the Ancien Régime was born in the Basque Country, with the largest percentage corresponding to the province of Vizcaya. Seventy-five years later, the picture is substantially different. The percentage of the population originating from the town remains the same (30%) but the percentage from the Autonomous Community has changed. Instead, more than half of Bilbao's residents were born outside this territory. At this time of the new century we can find people from all over Spain, good proof of the capacity of attraction that this city could exert on the entire peninsula. However, the nearby provinces were the ones that took advantage of the new employment opportunities opened up by industrialisation. The community of Castile and Leon stands out as the main provider of labour, although it can be specified that almost all of them were from the province of Burgos. In addition, the nearby communities of Cantabria, La Rioja, Navarra and Aragon were the main places of departure for immigrants.
Finalmente vamos a acabar de dibujar el sistema de Antiguo Régimen transicional de la villa de Bilbao con la observación de la variable de la mortalidad. Este es el único vértice que nos falta. Decíamos líneas arriba que este sistema demográfico se caracteriza por tasas de alta presión demográfica. Efectivamente, hemos comprobado las altas tasas de natalidad y de mortalidad que se registraban en la ciudad (gráfico 2 y tabla 5).
| Fuente: Registro parroquial: AHEV; Registro civil: ARCB; Censos de población: INE | |||
| Varones | Mujeres | Total | |
|---|---|---|---|
| 1825 | 33,34 | 36,55 | 35,01 |
| 1860 | 35,23 | 37,75 | 36,58 |
| 1877 | 31,19 | 34,02 | 32,82 |
| 1887 | 29,38 | 34,24 | 32,02 |
| 1900 | 25,6 | 31,14 | 28,31 |
En la tabla 8 presentamos la evolución del indicador de la esperanza de vida de Bilbao. Este indicador es mucho más completo y significativo de las condiciones de vida en que se vive y se muere en una sociedad que cualquier otro que podamos disponer. Así, podemos ver que durante el Antiguo Régimen los habitantes de Bilbao podían esperar vivir cuando nacían como media unos treinta y cinco años. Hay que decir que esta cifra era muy normal para esta época pre-industrial y significativamente alta para la península en el medio urbano. Con todo, podemos apreciar una mejoría en este indicador hacia mediados de siglo que nos indica que la etapa de entre-guerras fue un momento de bonanza socio-económica para la villa. A partir de ahí, la segunda guerra carlista y la industrialización trajeron consigo un descenso en esta vida media que supuso una pérdida de siete años con respecto a principios de siglo. En 1900 la esperanza de vida de Bilbao era la más baja y alarmante de toda España. Una rápida e intensa llegada de inmigrantes hacinados en determinados barrios bilbaínos, la falta de vivienda digna, las epidemias y enfermedades, los bajos salarios y el déficit alimentario, en resumen la pobreza de una amplia capa social de jornaleros, explican este descenso de calidad de vida. Este dato hay que valorarlo teniendo en cuenta que la edad media al matrimonio en estas fechas había descendido, pero resultaba insuficiente para garantizar una adecuada reproducción social.
Estas cifras adquieren todo su dramatismo si desentrañamos los componentes de la estructura de la mortalidad de Antiguo Régimen. En lo que a la mortalidad se refiere, el sistema demográfico se caracterizaba por una muy alta mortalidad infantil y por el predominio de las enfermedades y causas de muerte de origen infeccioso.
| Fuente: Registro parroquial: AHEV; Registro civil: ARCB | ||
| qo: Defunciones de niños menores de 1 año sobre el total de nacimientos por mil. q1-4: Defunciones de niños de 1 a 4 años sobre la población de esa misma edad por mil. | ||
| qo | q 1-4 | |
|---|---|---|
| 1825 | 160 | 253 |
| 1860 | 135 | 240 |
| 1877 | 201 | 248 |
| 1887 | 162 | 281 |
| 1900 | 199 | 279 |
En la tabla 9 se puede comprobar como de unos valores de mortalidad infantil altos pero muy moderados en el primer cuarto de siglo van aumentando considerablemente hasta la fecha de 1900 en donde alcanzan unos valores más altos nunca conocidos en la ciudad. Era usual en esta época que la mortalidad de los menores de 1 año fuera más baja que la de los niños de 1 a 4 años en donde las epidemias infecciosas hacían estragos sobre los pequeños que ya no disponían de las defensas naturales que les proporcionaba la leche materna. Así que si sumamos estos dos indicadores obtenemos que de un cuarenta a un cincuenta por ciento de los niños que nacían no alcanzaban a cumplir los cinco años. Esta era la principal razón de que la esperanza de vida descendiera o no pudiera alcanzar valores mayores en este siglo XIX.
| Fuente: Registro parroquial: AHEV; Registro civil: ARCB | |||
| 1869 | 1885 | 1900 | |
|---|---|---|---|
| Enf. Infecciosas | 83,17 | 69,83 | 72,18 |
| Aire | 61,4 | 66,54 | 72,42 |
| Agua | 20,25 | 15,47 | 11,72 |
| Otras infecciosas | 18,34 | 17,98 | 15,85 |
| No Infecciosas | 16,82 | 30,16 | 27,81 |
Otro rasgo de la estructura de la mortalidad y que explica la esperanza de vida lo constituía la estructura de las causas de muerte, principalmente de origen infeccioso y ante las cuales los conocimientos médicos no podían hacer nada. Hay que recordar que todavía no se conocen los antibióticos, de manera que cualquier gripe, sarampión, viruela o gastro-enteritis provocaban la muerte irremediable en aquellos más débiles por constitución o por malnutrición como los niños y los ancianos. En un medio frío y húmedo como el bilbaíno las enfermedades más comunes tenían su origen en la transmisión por aire, es decir, todas aquellas del aparato respiratorio. A finales de siglo, todo el colectivo obrero que vivía hacinado y desnutrido sufría de manera particularmente aguda el azote de epidemias que asolaban la ciudad todos los años y que mermaban la población de una manera tan alarmante que era motivo de titulares en los periódicos locales por parte de los responsables sanitarios municipales y de los médicos bilbaínos (Pareja: 1997).